
Y ou don’t need an advanced degree to make data-driven marketing decisions.
However, a basic grasp of statistics is essential for correctly interpreting campaign results, understanding A/B tests, and drawing reliable conclusions from your analytics. Without it, you risk acting on misleading data, cutting a winning test short, or investing in a strategy that only appeared to work by random chance.
This can lead to costly errors. You might scale a campaign that wasn’t truly effective or claim a victory that was just statistical noise. The good news is that a few core concepts are all you need to avoid these common traps.
This guide is your practical introduction to statistics for marketers. We will cover the essential concepts you need to run smarter, more effective campaigns—no complex equations, just straightforward explanations to help you build confidence in your data.
What We’ll Cover:
- Why sample size in marketing tests is critical
- Understanding confidence levels in A/B testing
- The difference between a real result and random noise
- How to interpret p-values without the jargon
- Avoiding the correlation vs. causation trap
- Why averages can sometimes hide the truth
1. Sample Size: Why More Data Leads to More Trust
One of the most frequent mistakes in marketing analytics is drawing conclusions from a small data set. When your sample size is too low, random fluctuations can create extreme results that aren’t sustainable or real.
Imagine you launch a new ad campaign. On the first day, ten people click through, and four make a purchase. That’s a 40% conversion rate. While impressive, it’s highly unlikely that four out of every ten people will convert. The sample is just too small to be reliable.
As you gather more data, the numbers will almost always regress toward a more realistic, stable average. After collecting 2,000 clicks, you might find that 80 people converted. Your conversion rate is now 4%, a far more accurate and trustworthy metric for forecasting.
Key takeaway: Avoid making decisions until you have collected enough data to minimize the impact of randomness. Dramatic swings in performance with small samples are common and often misleading. For A/B testing, a general rule is to aim for at least a few hundred conversions per variation to ensure your results have a stable foundation.
2. Confidence Levels and Statistical Significance Explained
These two concepts work together to tell you if your A/B test results are dependable. They act as a filter, helping you separate a true change in user behavior from random chance.
Confidence Levels in A/B Testing Explained
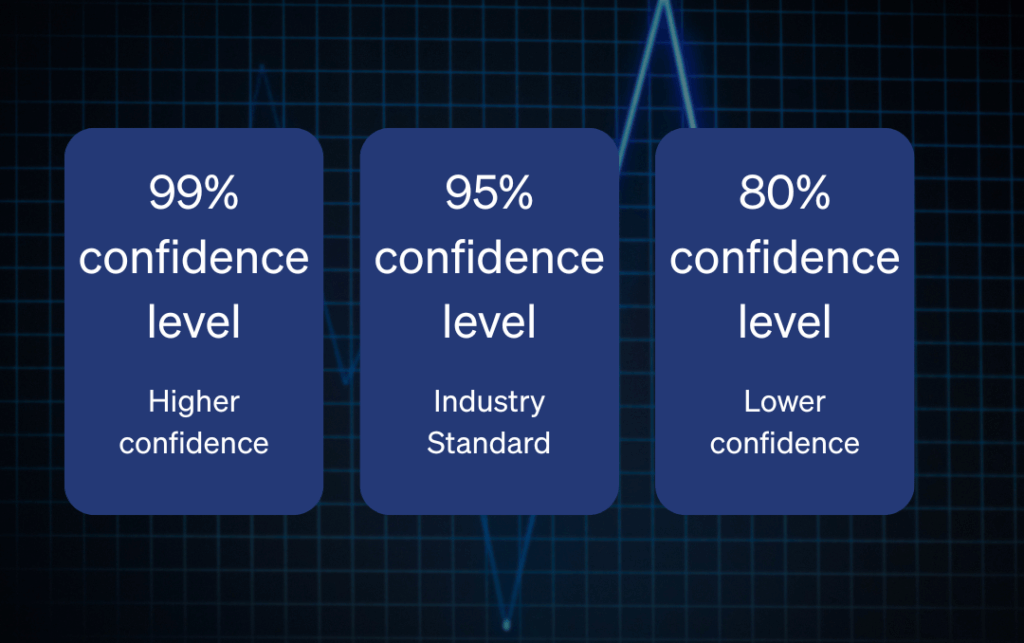
A confidence level tells you how certain you can be that your results are not a fluke. In marketing and web optimization, a 95% confidence level is the industry standard. This means if you were to run the same test 100 times, you would see the same winning result in at least 95 of those tests. The remaining 5% represents the risk that your outcome was due to random luck.
- Higher confidence (e.g., 99%) provides stronger proof but requires more traffic and time.
- Lower confidence (e.g., 80-90%) can offer directional insights but carries a higher risk of being wrong.
Think of it like a weather forecast. A 95% chance of rain means you should definitely bring an umbrella. An 80% chance means you still might, but you accept a greater possibility of staying dry.
What is Statistical Significance?
Significance is the direct output of your confidence level. If your test result reaches a 95% confidence level, it is considered “statistically significant.”
Let’s say you test a new checkout button. Version A (the original) has a 10% conversion rate, and Version B (the new design) has an 11% rate. Is that 1% lift a real improvement, or is it just statistical noise? Significance testing answers that question. If the result is not statistically significant, you cannot confidently declare Version B a winner, even if its conversion rate is higher.
Key takeaway: Always test until you reach your predetermined confidence level, typically 95%. Acting on non-significant results is equivalent to making a decision based on a coin flip.
3. P-Values: A Simple Definition
The p-value is another misunderstood metric, but its purpose is quite simple. The p-value measures the probability that the results you observed were purely due to random chance.
In short, it’s the probability of a fluke.
- A p-value of less than 0.05 (p < 0.05) is the standard for significance. It means there is less than a 5% chance that your result is random noise. This corresponds directly to a 95% confidence level.
- A smaller p-value means stronger evidence. A p-value of 0.01 suggests only a 1% chance that the outcome was random.
It’s important to know what a p-value is not. It doesn’t tell you the probability that your winning variation is the “true” winner or how big the uplift is. It only quantifies the likelihood that random chance created the observed difference.
4. Correlation vs. Causation: A Critical Distinction
It’s easy to assume that when two things happen at the same time, one must have caused the other. This is the classic trap of confusing correlation with causation.
- Correlation: Two variables move in the same direction. For example, ice cream sales and sunglass sales both increase during the summer. They are correlated.
- Causation: One event directly causes another. However, buying sunglasses doesn’t cause people to eat ice cream. The hidden factor is the warm weather, which causes both.
In a marketing context, you might see that revenue increased after you launched a new feature on your website. Did the feature cause the revenue lift? Not necessarily. Perhaps a major holiday occurred, a competitor went offline, or you were featured in a news article.
The only reliable way to prove causation is with a controlled experiment (like an A/B test), where you show the new feature to one group and not to another, keeping all other conditions the same.
5. Beyond Averages: Finding the Real Story in Your Data
The average is a useful starting point, but it can often hide important details. Relying solely on averages can lead to flawed strategies because they smooth over the nuances in customer behavior.
For example, imagine your site’s average order value (AOV) is $120. This could mean most customers spend around $120. Or, it could mean half your customers spend $40 while the other half spend $200. These two scenarios tell very different stories and call for different marketing actions. The first suggests a uniform customer base, while the second indicates distinct segments of low and high spenders.
To get the full picture, look beyond the average. Use tools like medians, distributions, and customer segments to understand your data more deeply. You may discover that new customers have a much lower AOV than returning ones, an insight that would be completely hidden by a single average.
A Marketer’s Quick Guide to Statistical Thinking
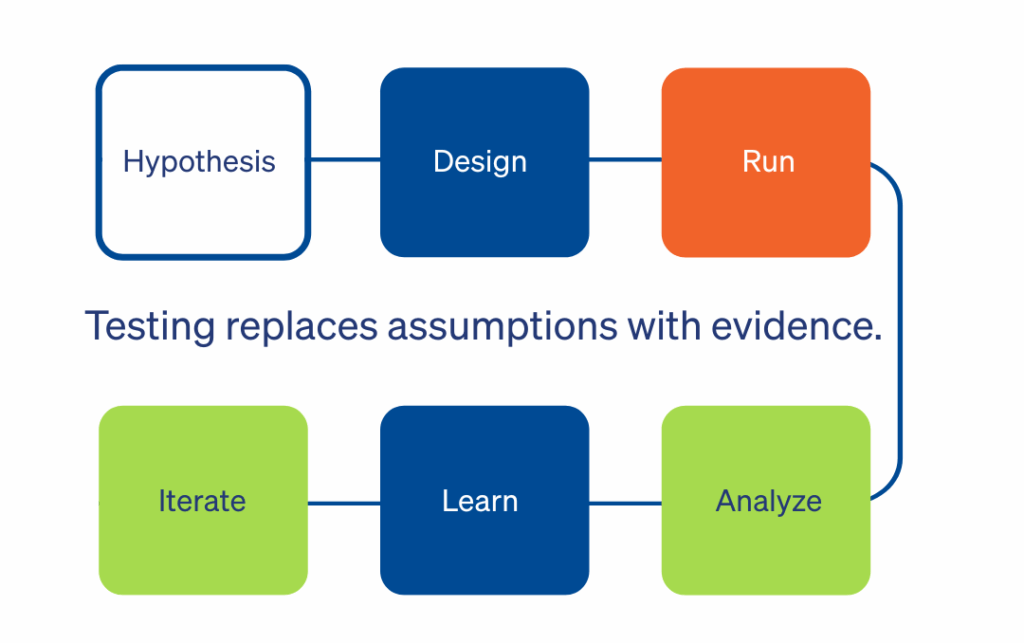
Mastering these basic statistics concepts for marketing will make you a stronger, more confident decision-maker. It’s not about becoming a statistician—it’s about reducing risk and replacing assumptions with evidence.
By building a culture of testing, you empower your team to learn faster and make smarter investments. Every test, even an inconclusive one, provides valuable information about your customers.
Frequently Asked Questions (FAQ)
1. How long should I run an A/B test?
A test should run long enough to collect a sufficient sample size and account for natural business cycles. A common mistake is stopping a test as soon as it reaches significance. Best practice is to run tests for full weekly cycles (e.g., 7, 14, or 21 days) to capture variations in user behavior between weekdays and weekends.
2. Is an 80% or 90% confidence level ever acceptable?
While 95% is the standard, a lower confidence level can be acceptable for low-risk decisions. For example, if you are testing a minor headline change where the cost of being wrong is minimal, an 85% confidence level might be enough to provide a directional signal. For high-stakes decisions, like a checkout redesign, you should always aim for 95% or higher.
3. What if my test result is inconclusive?
An inconclusive result—one that doesn’t reach statistical significance—is a learning opportunity. It tells you that the change you made was not impactful enough to create a detectable difference in user behavior. This might mean your hypothesis was incorrect or the change was too subtle. Use this outcome to iterate on your hypothesis and design a bolder test.


