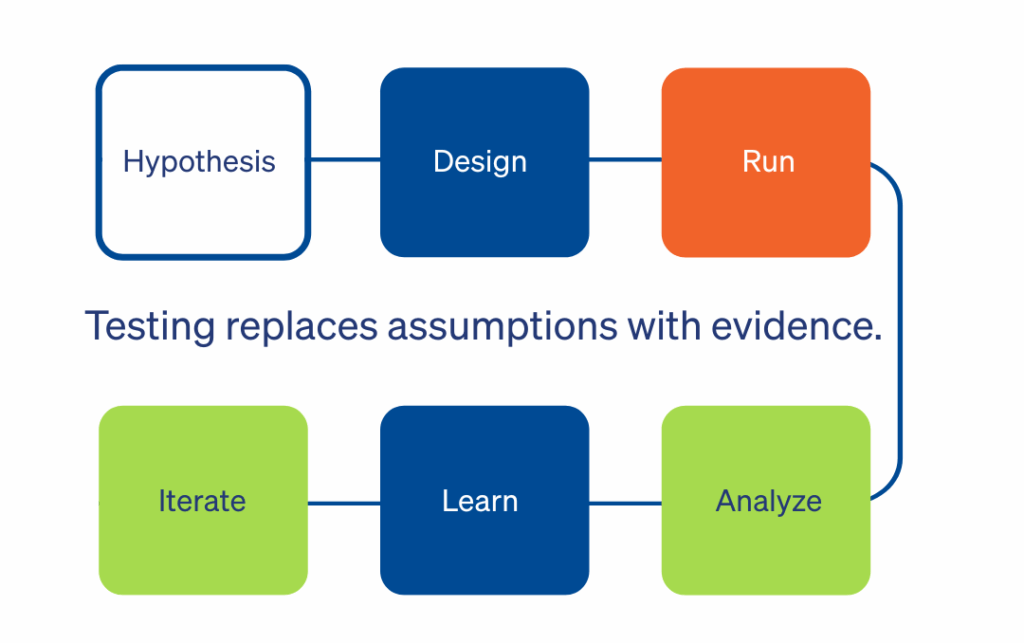
A great way to make decisions based on data in through A/B Testing. It gives you proof instead of speculation, so you can find out what your customers really want.
But it’s not as easy as just creating two versions of a webpage and waiting for a winner to perform a reliable test. If you commit a lot of typical A/B testing mistakes, your results could not be genuine, which could cause you to make bad business decisions based on bad data.
The first step to making a good experimentation program is to know about these problems. A well-done test gives clear, useful information, whereas a poorly done test causes confusion and wastes precious resources.
This tutorial lists the most common mistakes people make when doing A/B tests and gives clear, concrete ways to avoid them. We will give you the tools you need to execute experiments that give you accurate results and help your business develop.
1. Testing Without a Reason
When you run studies without a specific hypothesis, you often get random, inconclusive findings. It’s easy to get caught up in testing things on a whim, like starting a fresh headline just to “see what happens,” but this method doesn’t usually give you useful information.
What causes it: Being eager to get better outcomes or feeling like you have to “just test something” can get in the way of strategic planning.
Why it’s wrong: You can’t tell if something succeeded (or didn’t) or quantify success without a clear hypothesis.
What to do to remedy it:
- Always start with a precise, testable hypothesis, like “We think that changing X will make Y go up because of Z.”
- Make sure your tests have a goal, not just a notion for the sake of doing something.
- Write down your hypothesis in your pre-launch checklist so that it is clear and in line with the rest of your work.
2. Not Getting a Statistically Significant Result
One of the worst things you can do during A/B testing is end the test as soon as one version appears like it might be ahead. Early trends can be deceiving, and if you don’t have enough data, your “winner” could not be real.
Why it happens: Teams may be tempted to end experiments too soon because they are excited about the early results and feel pressure to proceed swiftly.
Why it’s wrong: A sample size or length that is too small makes conclusions that are not accurate and raises the chance of getting false positives or negatives.
How to correct it:
- Before you start your test, figure out how many samples you need and keep to that number.
- To account for changes from day to day and week to week, set a minimum test length, like one or two full business cycles.
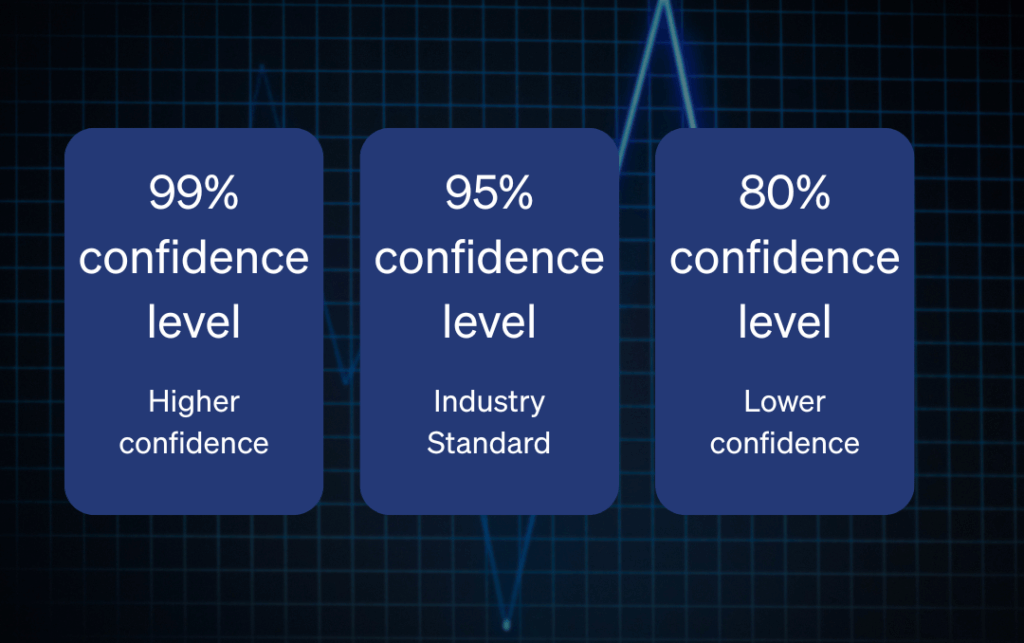
- Before you make any conclusions, use your post-launch checklist to make sure the results are statistically significant (usually 95% confidence or greater).
3. Trying to test too many things at once
If you modify more than one thing in a single test, such as headlines, graphics, and CTAs, you can’t tell which modification produced the outcome.
Why it happens: People who want to get the most out of their learning or group updates may make assessments too hard.
Why it’s wrong: Testing more than one variable makes it harder to see clearly what has to be done to improve performance.
How to repair it:
- When you can, just alter one variable at a time.
- If you need to test more than one thing, think about using a structured multivariate test (MVT) and make sure you have enough traffic.
- For the sake of transparency, write out exactly what is changing in your pre-launch checklist.
4. Not paying attention to differences between segments
A general outcome can hide how distinct groups of users react. Desktop users might be doing well, while mobile users might not be, or new visitors might act differently than returning consumers.
Why it happens: When you’re short on time, it’s best to merely look at the big picture.
Why it’s a bad idea: If you don’t have segment-specific knowledge, you can make adjustments that help some consumers but hurt others.
How to repair it:
- Decide ahead of time which user groups (by device, new vs. returning, geographical) you will look at.
- After the test, look at the findings by segment to find differences or trade-offs.
- Add segmentation analysis to your list of things to do after the test.
5. Ignoring Outside Factors
Tests done during holidays, sales, or abrupt traffic spikes can give results that won’t happen again in normal conditions.
Why it happens: Sometimes, tests are started without taking into account the big picture of the marketing calendar or strange circumstances.
Why it’s wrong: Outside variables might change how people perform, which can lead to wrong results.
How to fix it:
- Before scheduling tests, look for large campaigns, promotions, or events that are out of the ordinary.
- Write down anything strange that happens during your test and use that information in your analysis or even think about doing the test again.
- Add a phase to your pre-launch checklist to look over events that are coming up outside of your business.
6. Not writing down and sharing results
When test results and lessons learned aren’t recorded and shared, the institution loses vital knowledge. Teams keep making the same mistakes or losing chances to build on what they’ve learned in the past.
Why it happens: Teams move quickly and think about “what’s next” instead of what they’ve done.
Why it’s wrong: Not keeping track of results makes it harder for organizations to learn and slows down their efforts to improve in the future.
What to do to remedy it:
- Make a simple template to write down your hypothesis, the changes you tested, the findings, the statistical significance, and what you learned.
- Keep results in a place where the whole team can search and get to.
- Make sure to include documentation on your post-launch checklist.
7. Seeing testing as a one-time project
Long-term growth is hurt when people see A/B testing as a one-time event instead of an ongoing process.
What causes it: After a few tests, teams could decide that experimentation isn’t as important and only do it again when things go wrong.
Why it’s wrong: To keep making progress, learn new things, and adjust to how customers act, experimentation should never stop.
How to make it better:
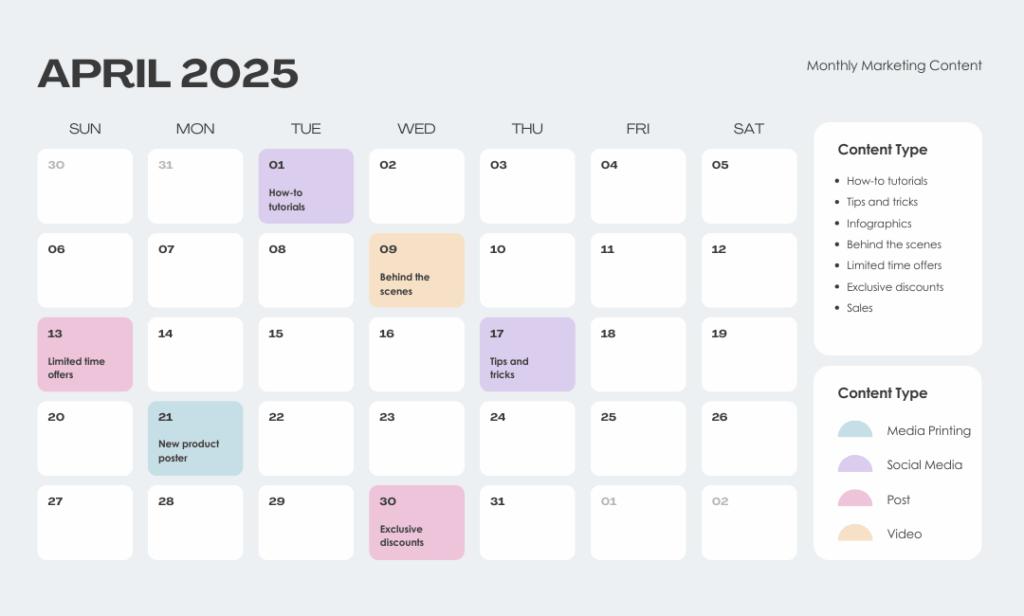
- Make A/B testing a regular part of your job and set up regular test cycles.
- Keep an eye on how things are doing over time and check for trends across different experiments.
- Make testing and learning a regular part of your marketing strategy.

7. Making assumptions based on small increase
Just because you have a greater conversion rate doesn’t guarantee you have a winner. To be reliable, the difference that was seen must be statistically significant.
What causes it to happen: Teams look at the raw conversion rates of each variation and choose the one with the greater number as the winner, not taking chance into account.
Why it’s wrong: You can’t be sure that the result is legitimate if A/B testing don’t show statistical significance. You are making a business decision based on a coin flip.
What to do to remedy it:
- Set a minimum level of confidence before you start (95% is the industry norm).
- Don’t say who won until your testing tool says the result is statistically significant at the level you set. If the results aren’t significant, treat them as inconclusive.
Checklists for A/B Testing Best Practices
List of Things to Do Before Launch
- Is the test hypothesis well-defined and recorded?
- Is the hypothesis easy to understand and test?
- Are you only changing one thing, or is your design set up to make it clear how different things work together?
- Is your main metric linked to an important company goal?
- Have you figured out how many samples you need and how long the test should last?
- Has the test been checked for quality on all major browsers and devices?
- Is QA done and analytics tracking checked for all versions?
Checklist After the Test
- Did the test go as long and have as many people as planned?
- Has statistical significance (95% confidence or greater) been reached and checked?
- Were the results for each segment (device, new/returning) looked at for differences?
- Were there any mistakes in tracking or outside events that could have changed the data?
- Have you written down and communicated the results, insights, and next steps with your team?
Common Questions (FAQ)
How long should I keep testing?
Your test should be long enough to get your sample size and span at least one full business cycle (seven days). Most organizations can trust that doing a test for 14 days will give them good results because it smooths out daily changes and shows how various users act.
Is it ever permissible to use a confidence level that is lower than 85% or 90%?
There is a reason why 95% is the standard, but for low-risk decisions, a lower confidence level may be fine. If you are evaluating a tiny modification where the risk of being incorrect is relatively minimal, an 85% confidence level could provide a useful directional suggestion. Always ask for 95% confidence or higher for any test that will have a big effect, like a redesign of the checkout sequence.
What should I do if my test results don’t provide me a clear answer?
A result that is not statistically significant is not a failure. It’s a chance to learn. It notifies you that the modification you made wasn’t big enough to influence how people use the site. This could suggest that your theory was erroneous or that you didn’t do it well enough. Use this information to come up with a new, bolder idea for your next test.
Conclusion
To create a culture of experimentation that gets genuine results, you need to stay away from these frequent A/B testing mistakes. If you want to go over the basics again, our CRO Statistics Foundations tutorial can help you remember the statistical ideas that make testing reliable.